The Observability Crisis
08.20.2024 | By: Jaya Gupta, Ashu Garg

We’ve inadvertently created a maze of complexity and cost in observability. How did this happen?
Let’s explore how this crisis emerged and the market dynamics that have shaped it.
The First Wave: Data Storage Proliferation
The initial winners in the observability space focused on solving the problems of data storage and analysis, building on the work of early pioneers:
- Wiley (founded 1998): The company developed software that monitored the performance of applications, allowing IT managers to diagnose bottlenecks and other issues. Wily Technology was notable for bringing APM to the Java platform, which was widely used for web applications during the early days of Web 1.0
- Splunk (founded 2003, went public in 2012, later acquired by Cisco for 28B+ in 2024): Splunk revolutionized log management allowing for efficient storage and retrieval of log data.
- AppDynamics (founded 2008, acquired by Cisco for 3B+): AppDynamics pioneered Application Performance Monitoring (APM) by utilizing a combination of relational databases and proprietary storage to manage and analyze application performance data effectively.
Later entrants like Datadog (founded 2010) and New Relic expanded on these foundations of Appdynamics by offering fuller-stack solutions and trying to unify different types of monitoring on one platform. They were built for the cloud-era.
These innovations illuminated previously opaque areas of IT infrastructure. At the same time, with the cloud, companies were experiencing exponential data growth – and drove up complexity by creating microservices and container based architectures. And, by the mid-2010s, organizations were grappling with petabyte-scale observability data annually.
This data explosion created a paradox: as information volume increased, extracting actionable insights became more difficult. Traditional query languages and visualization tools struggled to keep pace. Organizations found themselves investing in data lakes and advanced analytics platforms just to make sense of their observability data. Cardinality explosion in high-dimensional metric data and the sheer volume of log data pushed the limits of even the most advanced time-series and search databases.
It’s not just a needle in a haystack problem; it’s as if the haystack is growing faster than our ability to search it. So what happens when the haystack grows so big that it becomes so difficult to search it?
The challenge shifted from data collection to efficient storage, retrieval, and analysis.
The Second Wave: Control the Volume, Velocity and Variety of the Data
The second wave of observability solutions emerged as a direct response to twin challenges that threatened to overwhelm enterprises: exponentially growing data complexity and skyrocketing costs.
As organizations rapidly embraced cloud-native architectures, microservices, and DevOps practices, the observability landscape underwent a dramatic transformation. The proliferation of containers, orchestration platforms like Kubernetes, and the acceleration of deployment frequencies triggered an unprecedented explosion in the volume, velocity, and variety of telemetry data.
These shifts introduced complexity:
- Microservices architectures exponentially increased the number of components generating data
- Containers and Kubernetes injected layers of metadata and labels, adding richness but also complexity
- Accelerated deployment cycles demanded more granular and real-time monitoring
- Rich client-side applications began transmitting increasingly detailed telemetry data
While Wave 1 players expanded their offerings to handle the complexity, their business models were often based on data ingestion volume, which inherently incentivized collecting more data, regardless of its utility. As cloud adoption accelerated and system complexity grew, these companies found themselves in a position where their revenues grew in tandem with their customers’ data volumes and challenges. They used their product expansions as a way to stay relevant in a highly evolving market, justify higher costs by offering more features, and positioning themselves as one-stop shops for all observability needs.
However, this approach often led to feature bloat and increased complexity, potentially exacerbating the very problems they claimed to solve.
That is where Wave 2 comes in. Wave 2 players were designed and sold to the same customers who saw these rising bills and were TRAPPED. They focused on getting the customer out of some of the specific traps Wave 1 players created:
- Honeycomb: Addressed the cardinality trap by building a system designed for high-cardinality data from the ground up.
- Grafana Labs: Tackled the tool sprawl trap by offering a unified visualization layer across various data sources.
- Cribl: Addressed multiple traps (data volume, cardinality, over-instrumentation) by introducing the concept of an observability pipeline.
- Chronosphere: Focused on the cardinality trap and query complexity trap with its observability control plane.
These successful players introduced unique solutions platforms at corralling the explosion of telemetry data and Wave 1 trap – some of the biggest success in Wave 2 is its laser focus on cost control – a direct assault on the crippling volume-based pricing models of the first wave.
A standout in this wave was Cribl (2017), who emerged as the poster child of the data volume trap. Their LogStream product allowed companies to route, reshape, and enrich data before it reaches its final destination. This approach gave organizations control over their observability data, helping to manage costs and improve signal-to-noise ratios. By enabling data reduction and intelligent routing, Cribl directly addressed the runaway costs that had become a critical pain point for many enterprises using first-wave observability solutions. Cribl’s meteoric rise – reaching $100 million in ARR in under five years – underscored the urgency of the cost crisis and the market’s hunger for solutions.
Their success makes sense as some large enterprises grappled with annual observability bills soaring into the millions (or $65M if you are Coinbase).
Wave 2 found success (and are still finding it) because they addressed the traps Wave 1 created. They provided ways to manage the flood of data, create cohesive views across disparate systems, and ask more complex questions about system behavior. They helped organizations cope with the complexity and cost introduced by first-wave solutions and cloud-native architectures.
However, while these solutions have made significant strides in managing the flood of observability data, these problems remain unsolved. Companies like Clickhouse, Databricks, Snowflake and Conviva are all extending their offerings in this category. We also believe that there is likely further innovation ahead of us here.
Furthermore, Wave 2 companies all largely fail to address the most important challenge, which is the labor challenge. Threading through both these waves is a critical shortage of SREs; All of this tooling has created significant engineering overhead to manage tools and control costs and increased cognitive load on senior engineers. These highly skilled professionals, commanding salaries well into six figures, spend up to 30% of their time merely triaging alerts. More alarmingly, despite investments in tools and talent, the MTTR for critical incidents still averages 4-5 hours. This human bottleneck represents an enormous hidden cost and efficiency drain.
The haystack is still growing faster than our ability to find the needle, setting the stage for the next wave of observability innovation.
The Third Wave: Reimagining Root Cause Analysis
We stand on the brink of a new era in observability, one that circles back to the fundamental question: What caused the incident, and how do we prevent it from recurring?
This third wave is necessary because, despite the successes of the first two waves, we’re still struggling with core issues:
- Data overload: We’re collecting more data than ever, but struggling to derive actionable insights.
- High costs: Current pricing models incentivize data hoarding rather than efficient problem-solving.
- Human bottlenecks: SREs are overwhelmed, spending too much time on triage rather than strategic work.
- Persistent downtime: Despite our investments, MTTR for critical incidents remains high.
The third wave aims to address these issues head-on by fundamentally changing how we approach observability.
This is where we are today – and where LLMs along with other classical ML techniques and system optimizations will come to play.
Imagine AI-driven tools that:
- Provide natural language interfaces to query complex systems
- Automatically generate and update incident response playbooks
- Offer predictive maintenance by recognizing patterns across heterogeneous data sources
- Synthesize post-mortem reports, distilling insights from terabytes of data
The potential impact? Slashing MTTR by an order of magnitude and freeing up countless engineering hours.
Shift from Volume Based Pricing to Outcome-Based Pricing
Today’s observability pricing models are primarily volume-based, leading to skyrocketing costs as data grows exponentially. Datadog, a leader in the space, has seen customers with monthly bills exceeding $100,000, and in some cases even reaching millions per year for large enterprises. Splunk users have reported similar experiences, with some organizations spending over $1 million annually on log management alone.
This pricing model is fundamentally flawed. It incentivizes vendors to encourage data hoarding rather than intelligent data usage. Companies are paying for the volume of data stored and processed, not for the value extracted from that data. This has created a perverse incentive structure where vendors profit from complexity and data inflation, rather than from solving real problems.
The first wave of observability companies made their fortunes by creating and exploiting this complexity. The second wave, including companies like Cribl, have capitalized on reducing this complexity and helping manage costs. However, neither approach addresses the core issue: are we actually solving problems faster and more effectively?
Imagine a world where we paid for observability tools based on their ability to accurately identify root causes or reduce MTTR. This shift from volume-based to value-based pricing could revolutionize the industry, aligning incentives and driving innovation where it matters most.
In this new paradigm, vendors would be rewarded for:
- Quickly identifying the root cause of issues
- Reducing the time to resolve incidents
- Preventing problems before they occur
- Minimizing false positives and alert fatigue
The winners in this next phase won’t just be those who can store or route data most efficiently, but those who can extract meaningful, actionable intelligence from the complexity we’ve built.
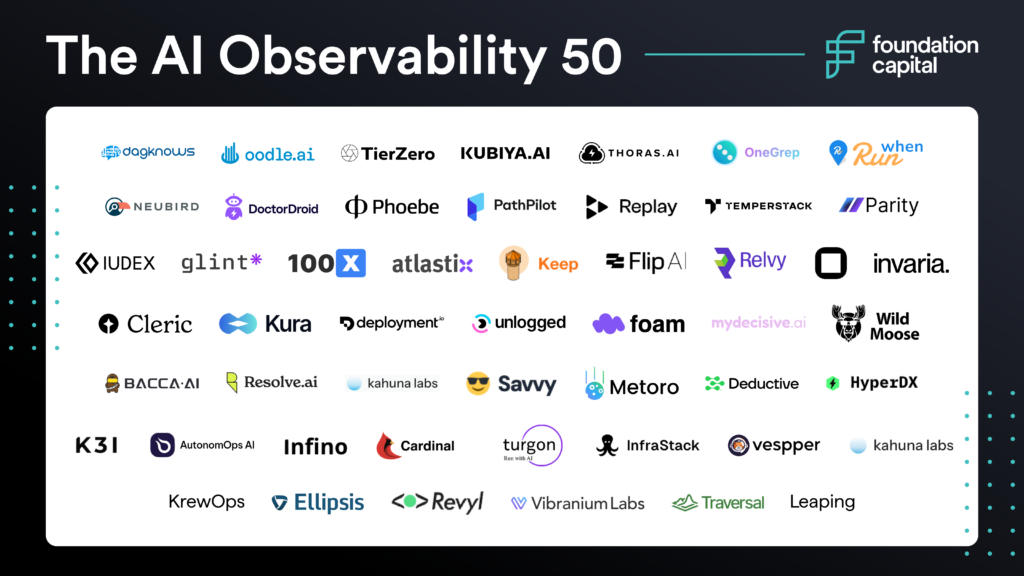
Introducing the AI Observability 50
Here are the 50 best companies in the space tackling the observability crisis.

Conclusion
The observability landscape is primed for disruption. Who will be the first to truly solve the root cause of our observability crisis?
Published on August 20, 2024
Written by Foundation Capital


